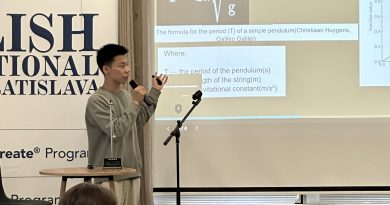
Testing robotic cars with distance – time graphs
In a recent Science investigation, our Year 7 students had the opportunity to explore one of the fundamental concepts in Physics: speed and motion. This activity was closely linked with their Digital Design lessons, where students constructed and programmed their own robotic cars designed to move at a constant speed along a straight black line.
The main goal of the Science lab was to test whether the programmed robotic cars truly maintained a constant speed in real-life conditions.
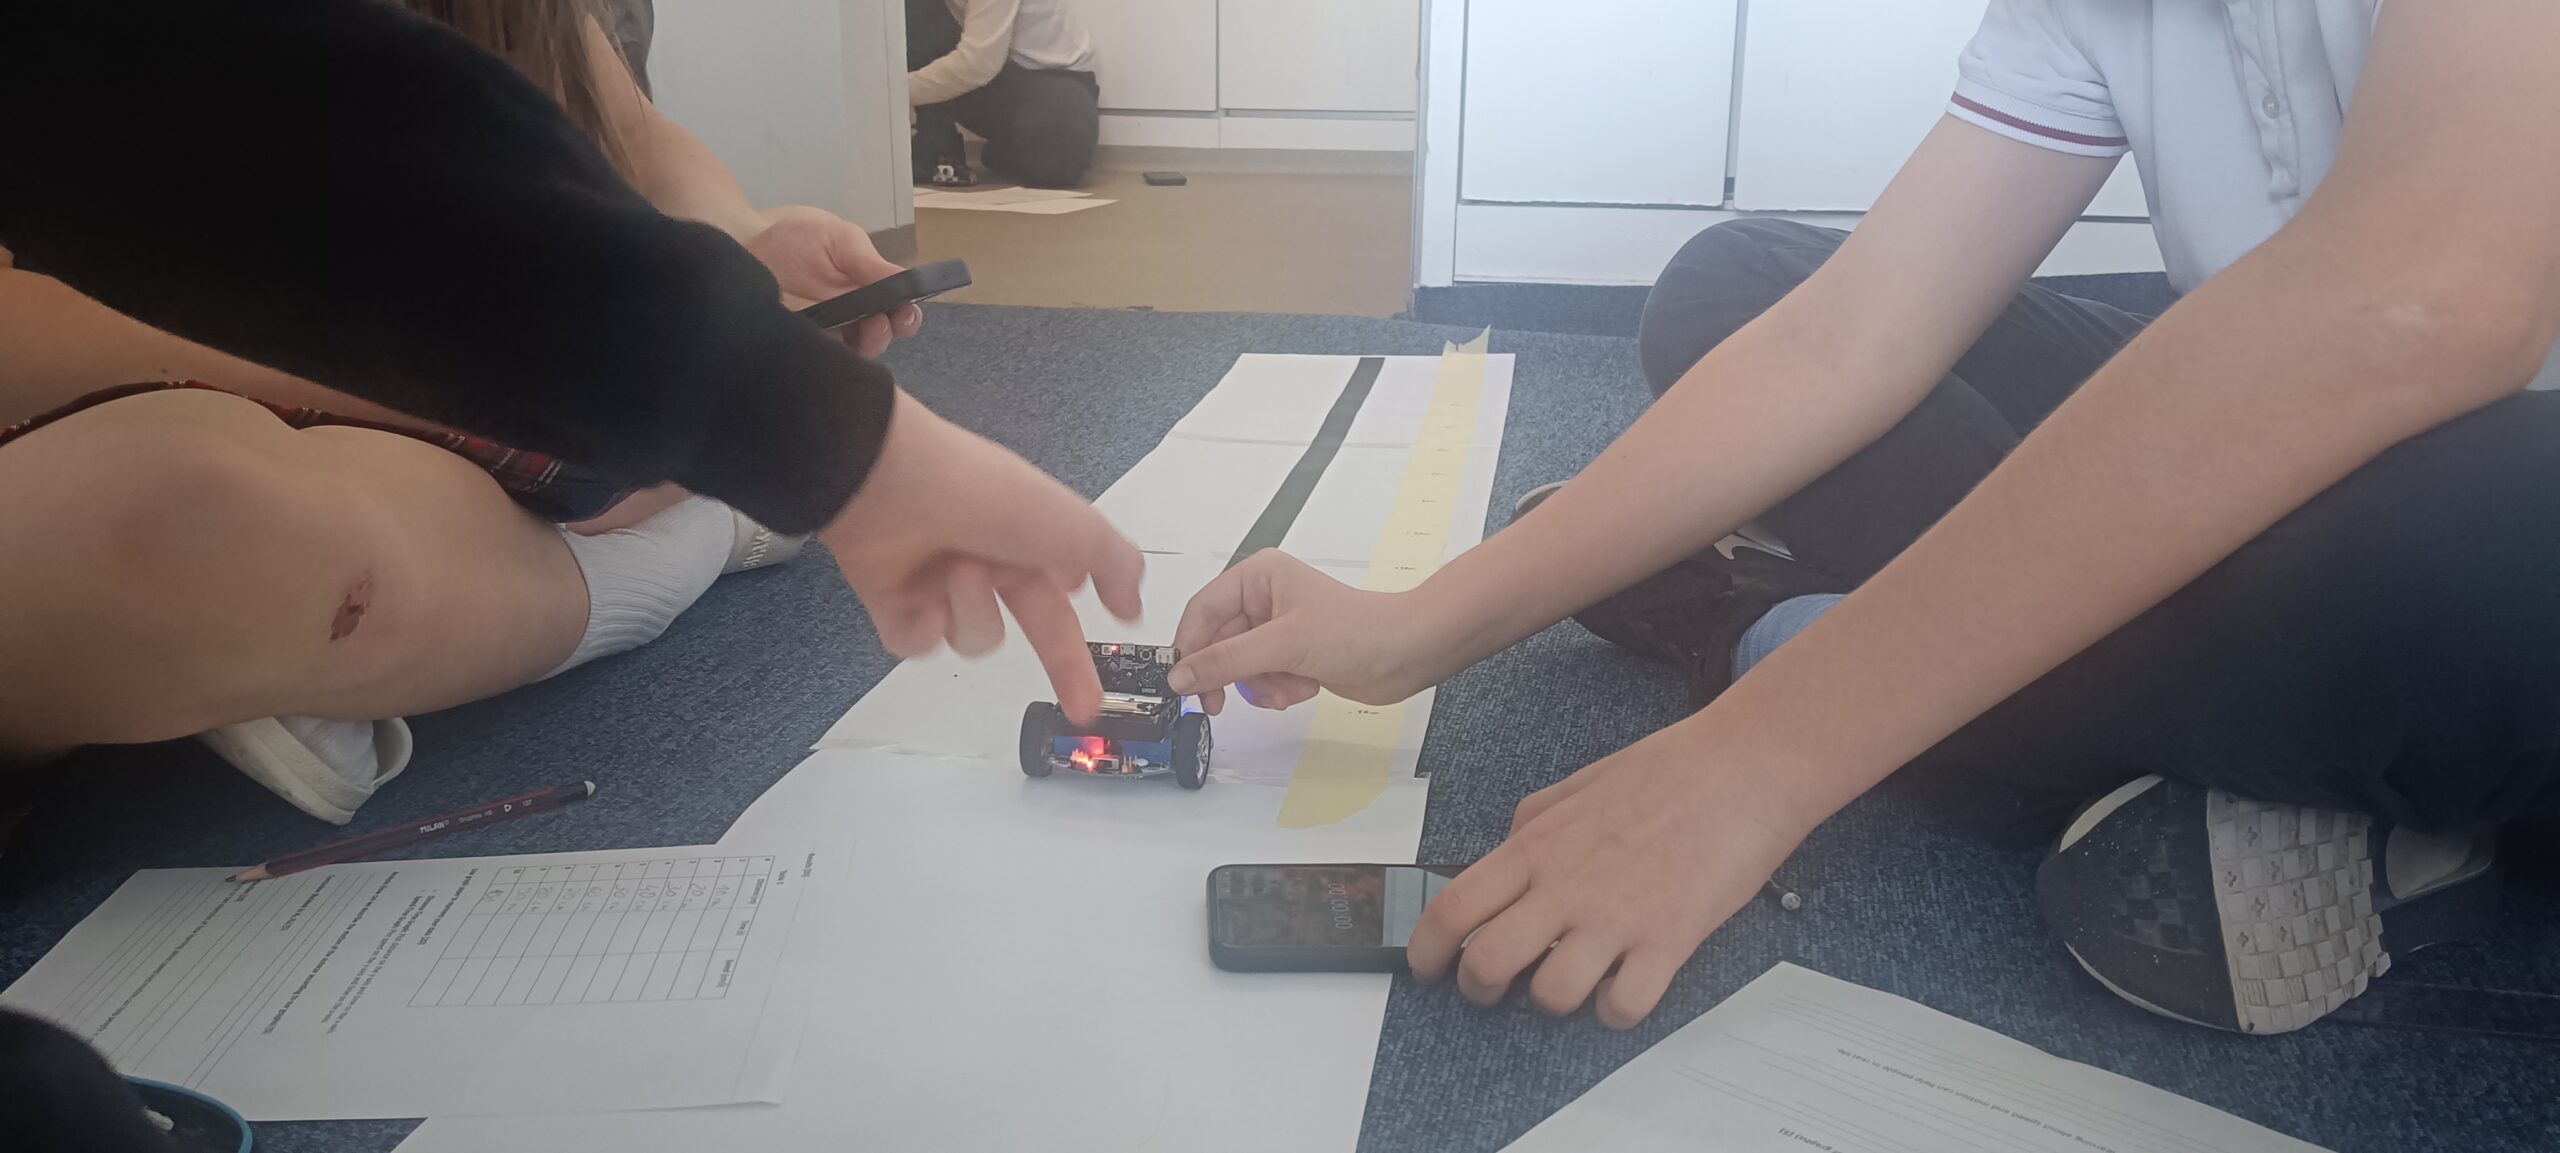
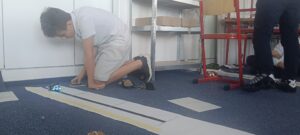
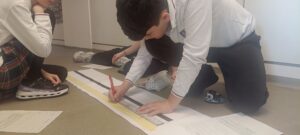
To investigate this, students worked collaboratively and followed a structured experimental procedure. Each autocar was placed at the starting point of a straight black line on a flat surface, carefully aligned to ensure a precise path of motion. Along this line, students used rulers and tape to mark regular distance intervals (10 cm, 20 cm, 30 cm, 40 cm, and so on).
One student released the autocar without any push, allowing it to move freely under its programmed settings. At the same time, another student used a stopwatch to measure the time taken for the autocar to reach each marked distance.
Using this data, students then calculated the speed at each interval using the formula:
speed = distance ÷ time
To further investigate whether the speed was constant, students plotted a distance–time graph. They learned that for motion to be at constant speed, the graph should form a straight line with a constant slope. By analysing the shape of their graphs, students were able to determine whether the motion of the autocar was truly uniform.


By combining skills from Science and Digital Design, students were able to see how programming, engineering, and physics work together in modern technology.
It was an exciting and insightful experiment that highlighted curiosity, collaboration, and critical thinking at the heart of STEM learning!