“Hands-on” learning
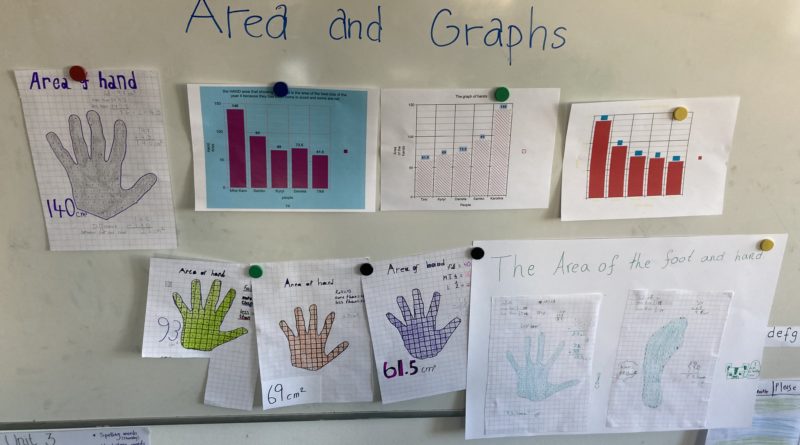
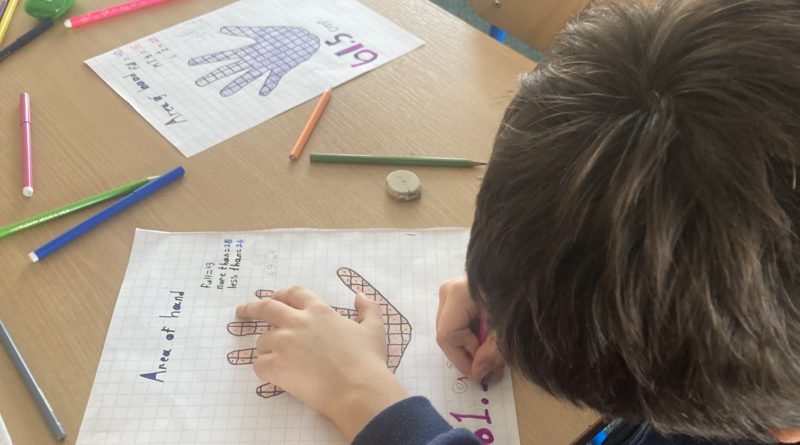
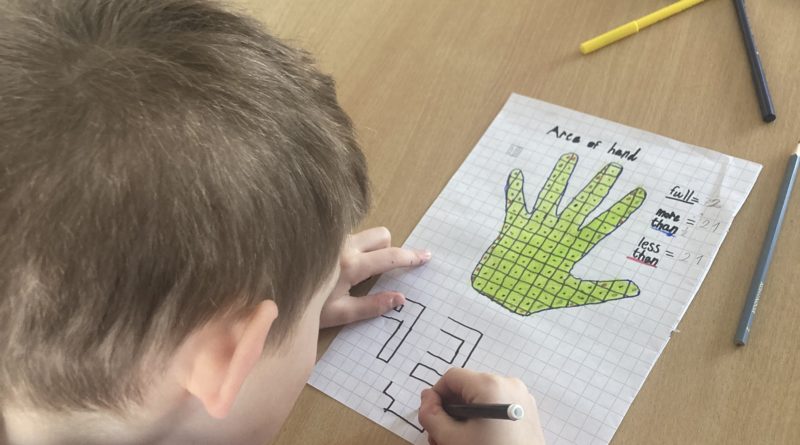
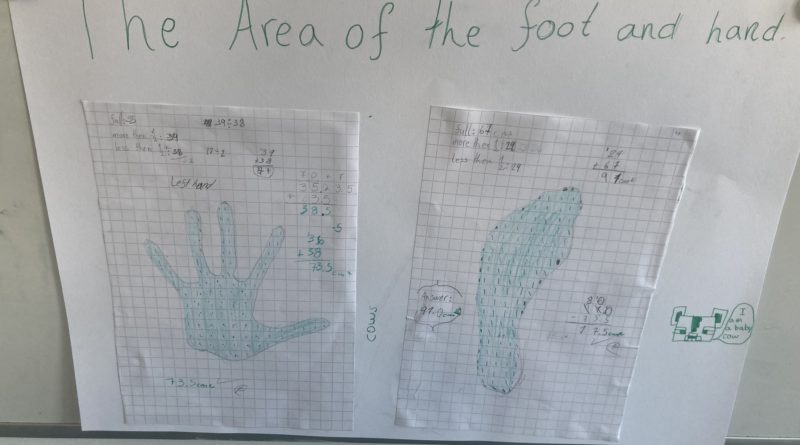
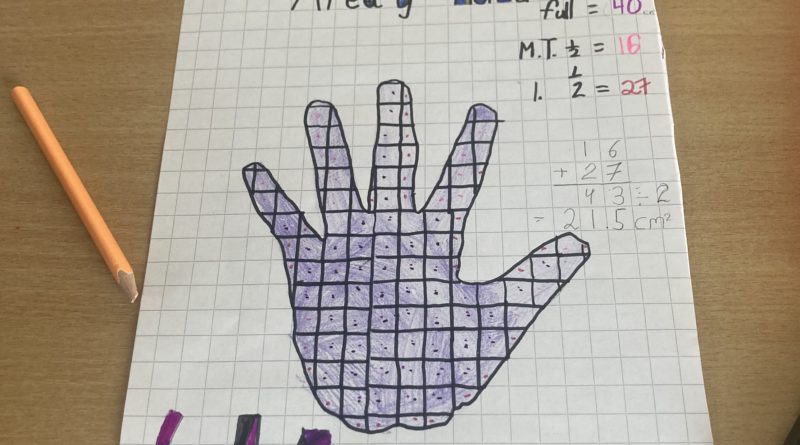
Year 4 had a blast diving into the world of area and graphs this unit. We measured the area of our hands using squared paper and compared our hand sizes, discovering the nitty-gritty of precision. Talk about “hands-on” learning! Some ideas of extending the project emerged, students were eager to measure their hands each month, and to graph their growth this way, so watch out for an update on this post.
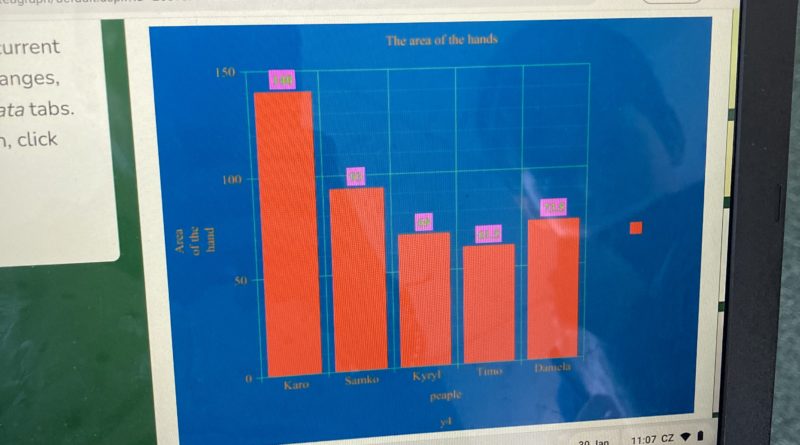
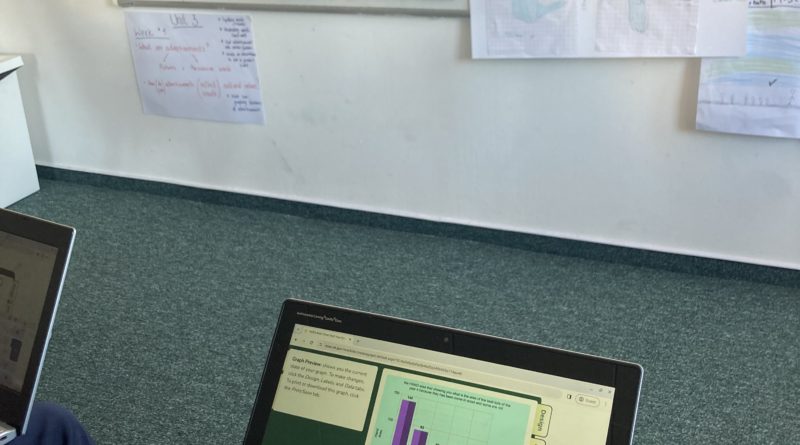
But the fun did not stop there – during our ICT lesson, we went digital! Armed with tech-savvy skills, we graphed the class results on a bar graph. We could now see our hand sizes in colorful graphs, each one telling a unique story. It was a bit of data overload at first, but when you think about it, the math we use is mostly data telling a story. A challenge for you with your children: go out for a walk and do a little data hunt. Find math in the displays, in posters, anywhere around you, and try to tell the story each number is hiding.

What a fantastic activity!