Graphs: How They Tell Stories About Changing Quantities
Our Year 7 Science students recently embarked on an exciting journey into the world of data analysis and graph plotting as part of the IB MYP curriculum. This exploration not only improved their analytical skills but also stimulated their curiosity about how data can tell a story.
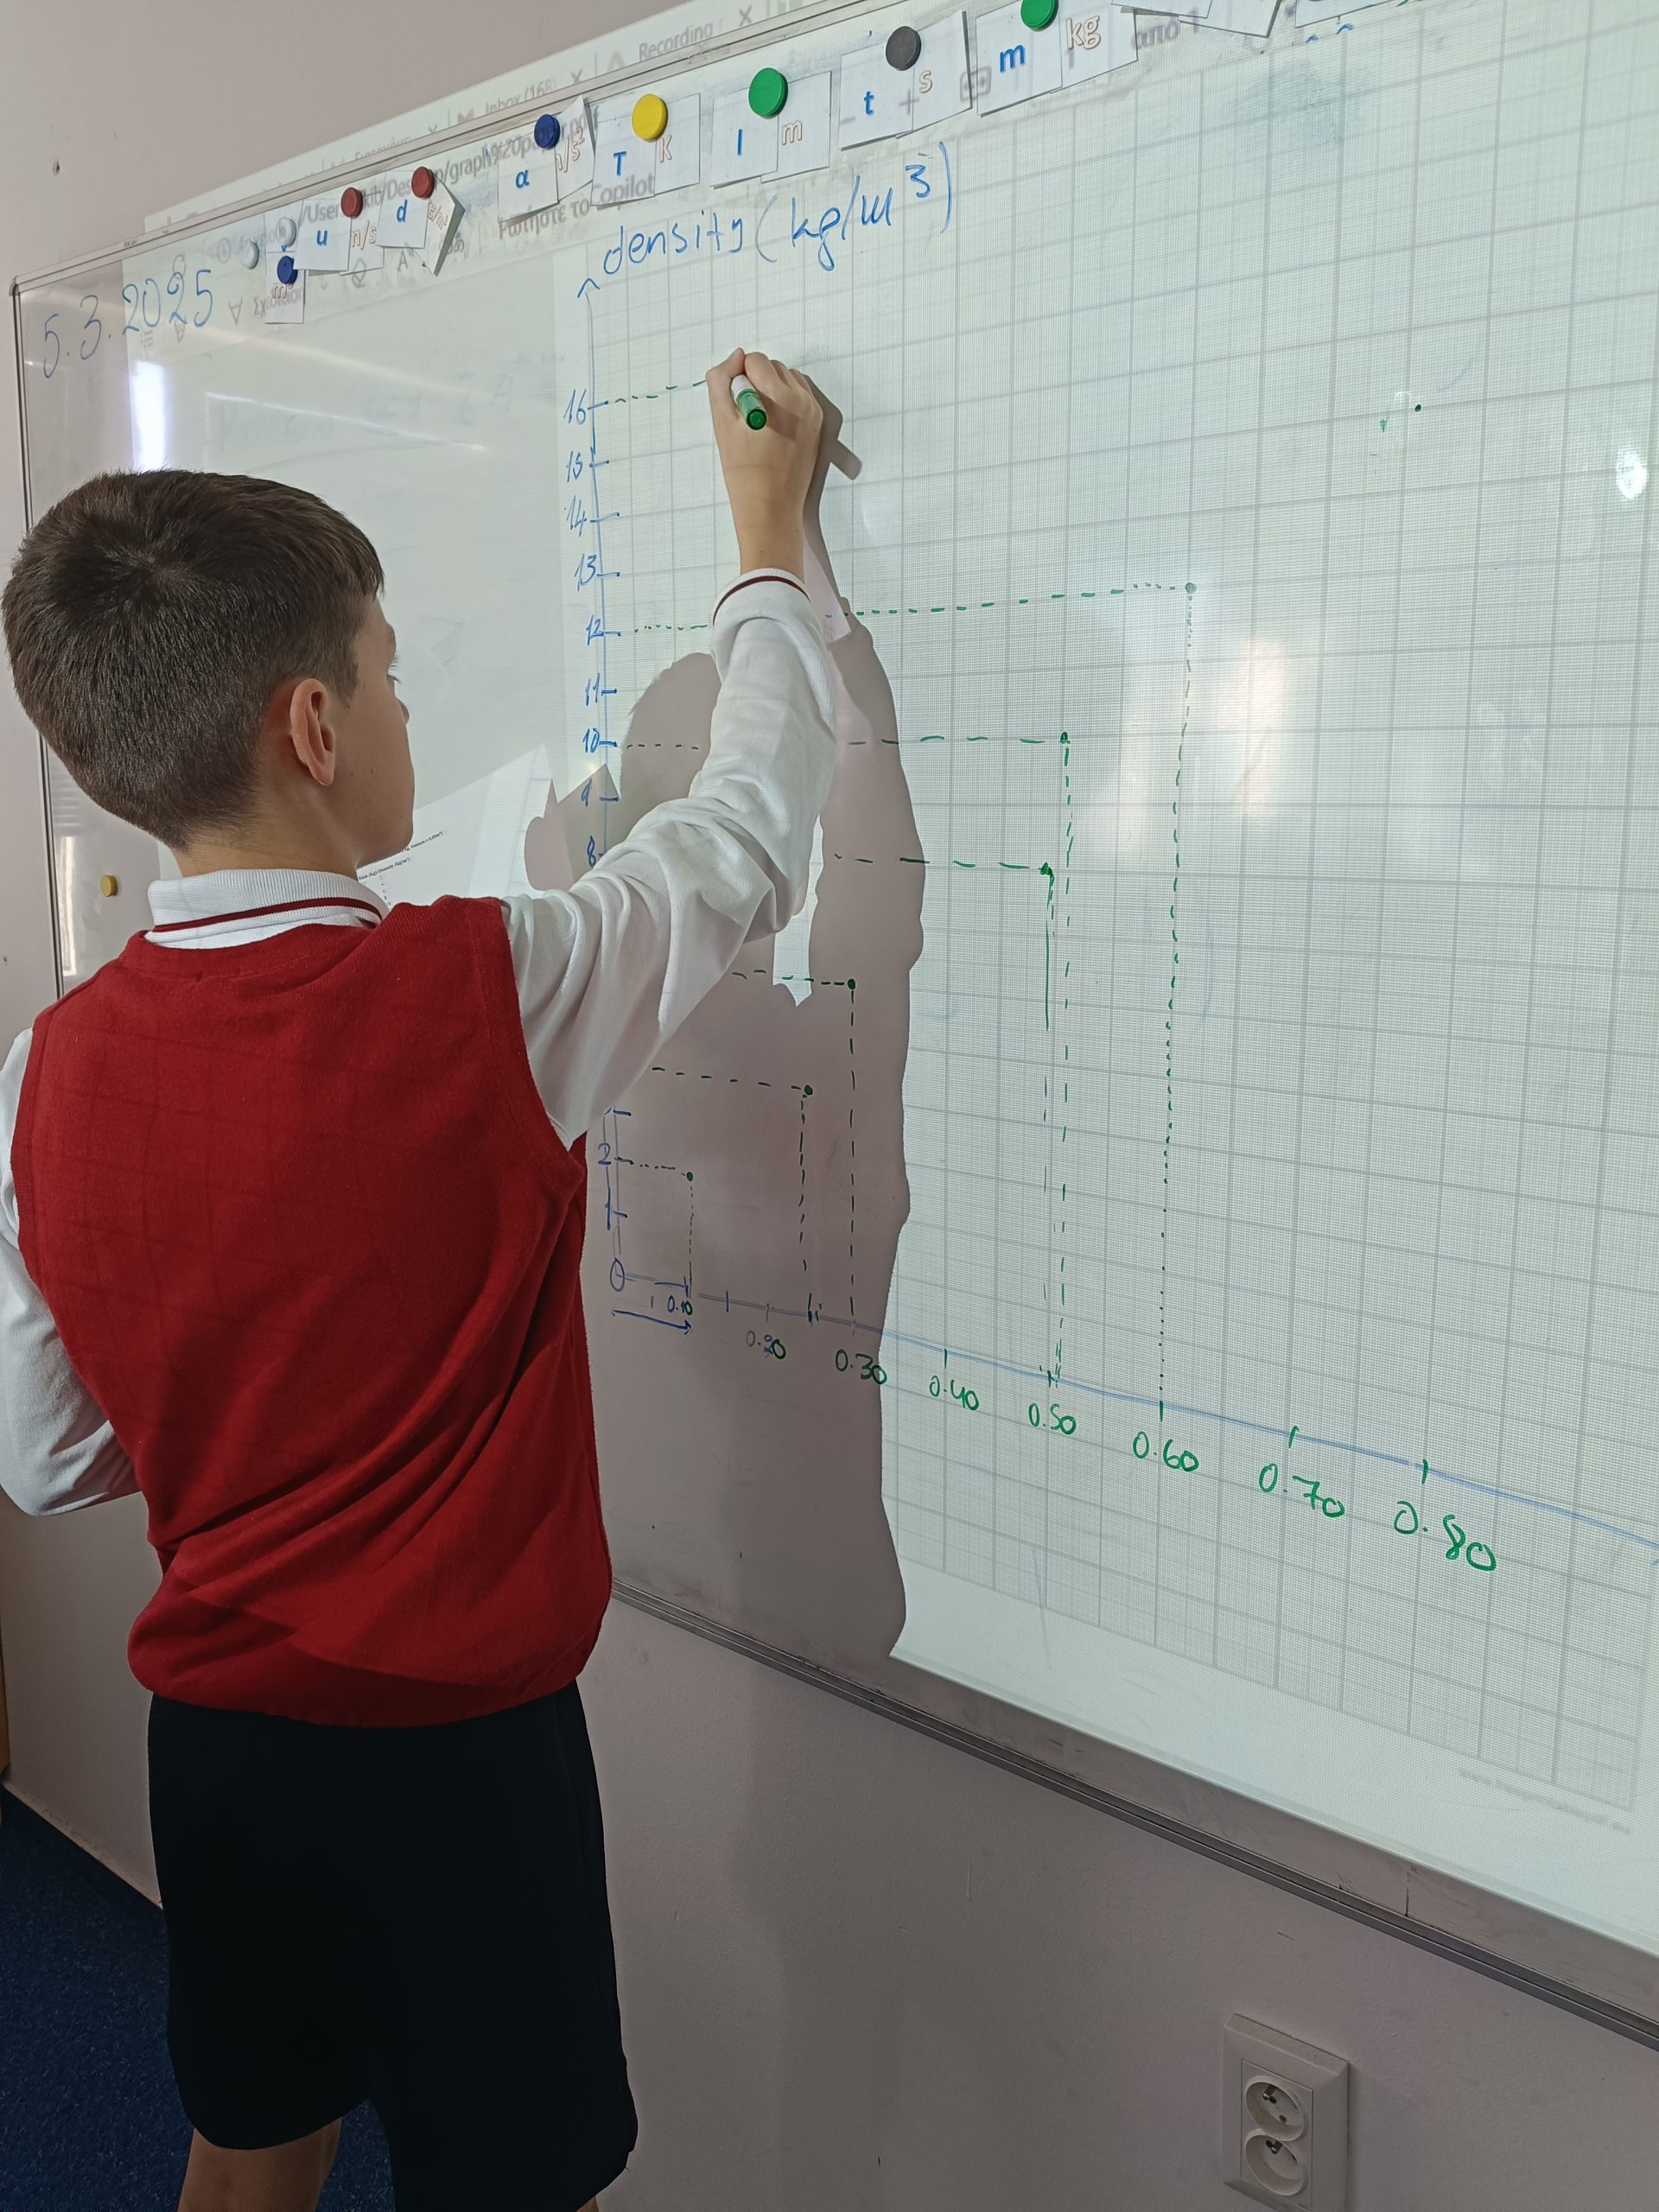
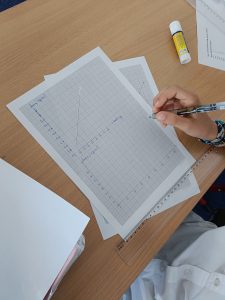
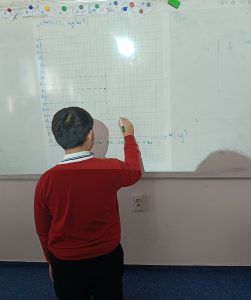
A key focus of the unit was practicing how to calibrate axes and accurately plot points for a linear relationship between mass and density. By carefully setting up their graphs and ensuring precision in their plotting, students gained a deeper understanding of how mathematical relationships translate into visual representations.
More importantly, they discovered how to analyze trends, identify patterns, and draw meaningful conclusions from their findings.
Many students expressed how engaging and enjoyable they found this process. They were fascinated by the way graphs could simplify complex information.
The enthusiasm and excitement displayed by our Year 7 students in this topic have been truly inspiring. Their ability to interpret and communicate data will serve as a valuable skill not only in Science but in various aspects of their academic journey!